library(tidyverse)
library(tidytext)
library(ggthemes)
library(reactable)Required Packages
Data Frames Used
nyc_dog_license <- read_csv('https://bcdanl.github.io/data/nyc_dog_license.csv')
nyc_zips_coord <- read_csv('https://bcdanl.github.io/data/nyc_zips_coord.csv')
nyc_zips_df <- read_csv('https://bcdanl.github.io/data/nyc_zips_df.csv')
Dog Breeds Across NYC Boroughs
top10_breeds <- nyc_dog_license |> count(breed_rc) |> arrange(-n) |> head(10)
top10_breeds$breed_rc
[1] "Yorkshire Terrier" "Labrador (or Crossbreed)"
[3] "Shih Tzu" "Pit Bull (or Mix)"
[5] "Chihuahua" "Maltese"
[7] "Pomeranian" "Havanese"
[9] "Shih Tzu Crossbreed" "Beagle" dog_df <- nyc_dog_license |> filter(!is.na(borough), breed_rc %in% top10_breeds$breed_rc) |>
count(borough, breed_rc) |> group_by(borough) |> arrange(-n)
dog_df$breed_rc <- factor(dog_df$breed_rc, levels = top10_breeds$breed_rc)
reactable(dog_df, columns = list(borough = colDef(name = "Borough"),
breed_rc = colDef(name = "Breed"),
n = colDef(name = "Count")))ggplot(dog_df, aes(x = n, y = reorder_within(breed_rc, n, borough),
fill = breed_rc)) +
geom_col(width = 1, color = "gray40", linewidth = 0.2) +
facet_wrap(~borough, scales = "free_y", ncol = 1) +
scale_y_reordered() +
scale_fill_tableau() +
labs(x = "Count",
y = NULL,
fill = "Breeds",
title = "Dog Breeds Across NYC Boroughs") +
guides(fill = guide_legend(keyheight = 2.3)) +
theme_bw() +
theme(plot.title = element_text(hjust = 0.5, size = 18, face = "bold"),
axis.text = element_text(size = 10),
legend.text = element_text(size = 10),
strip.text = element_text(size = 10, face = "bold"))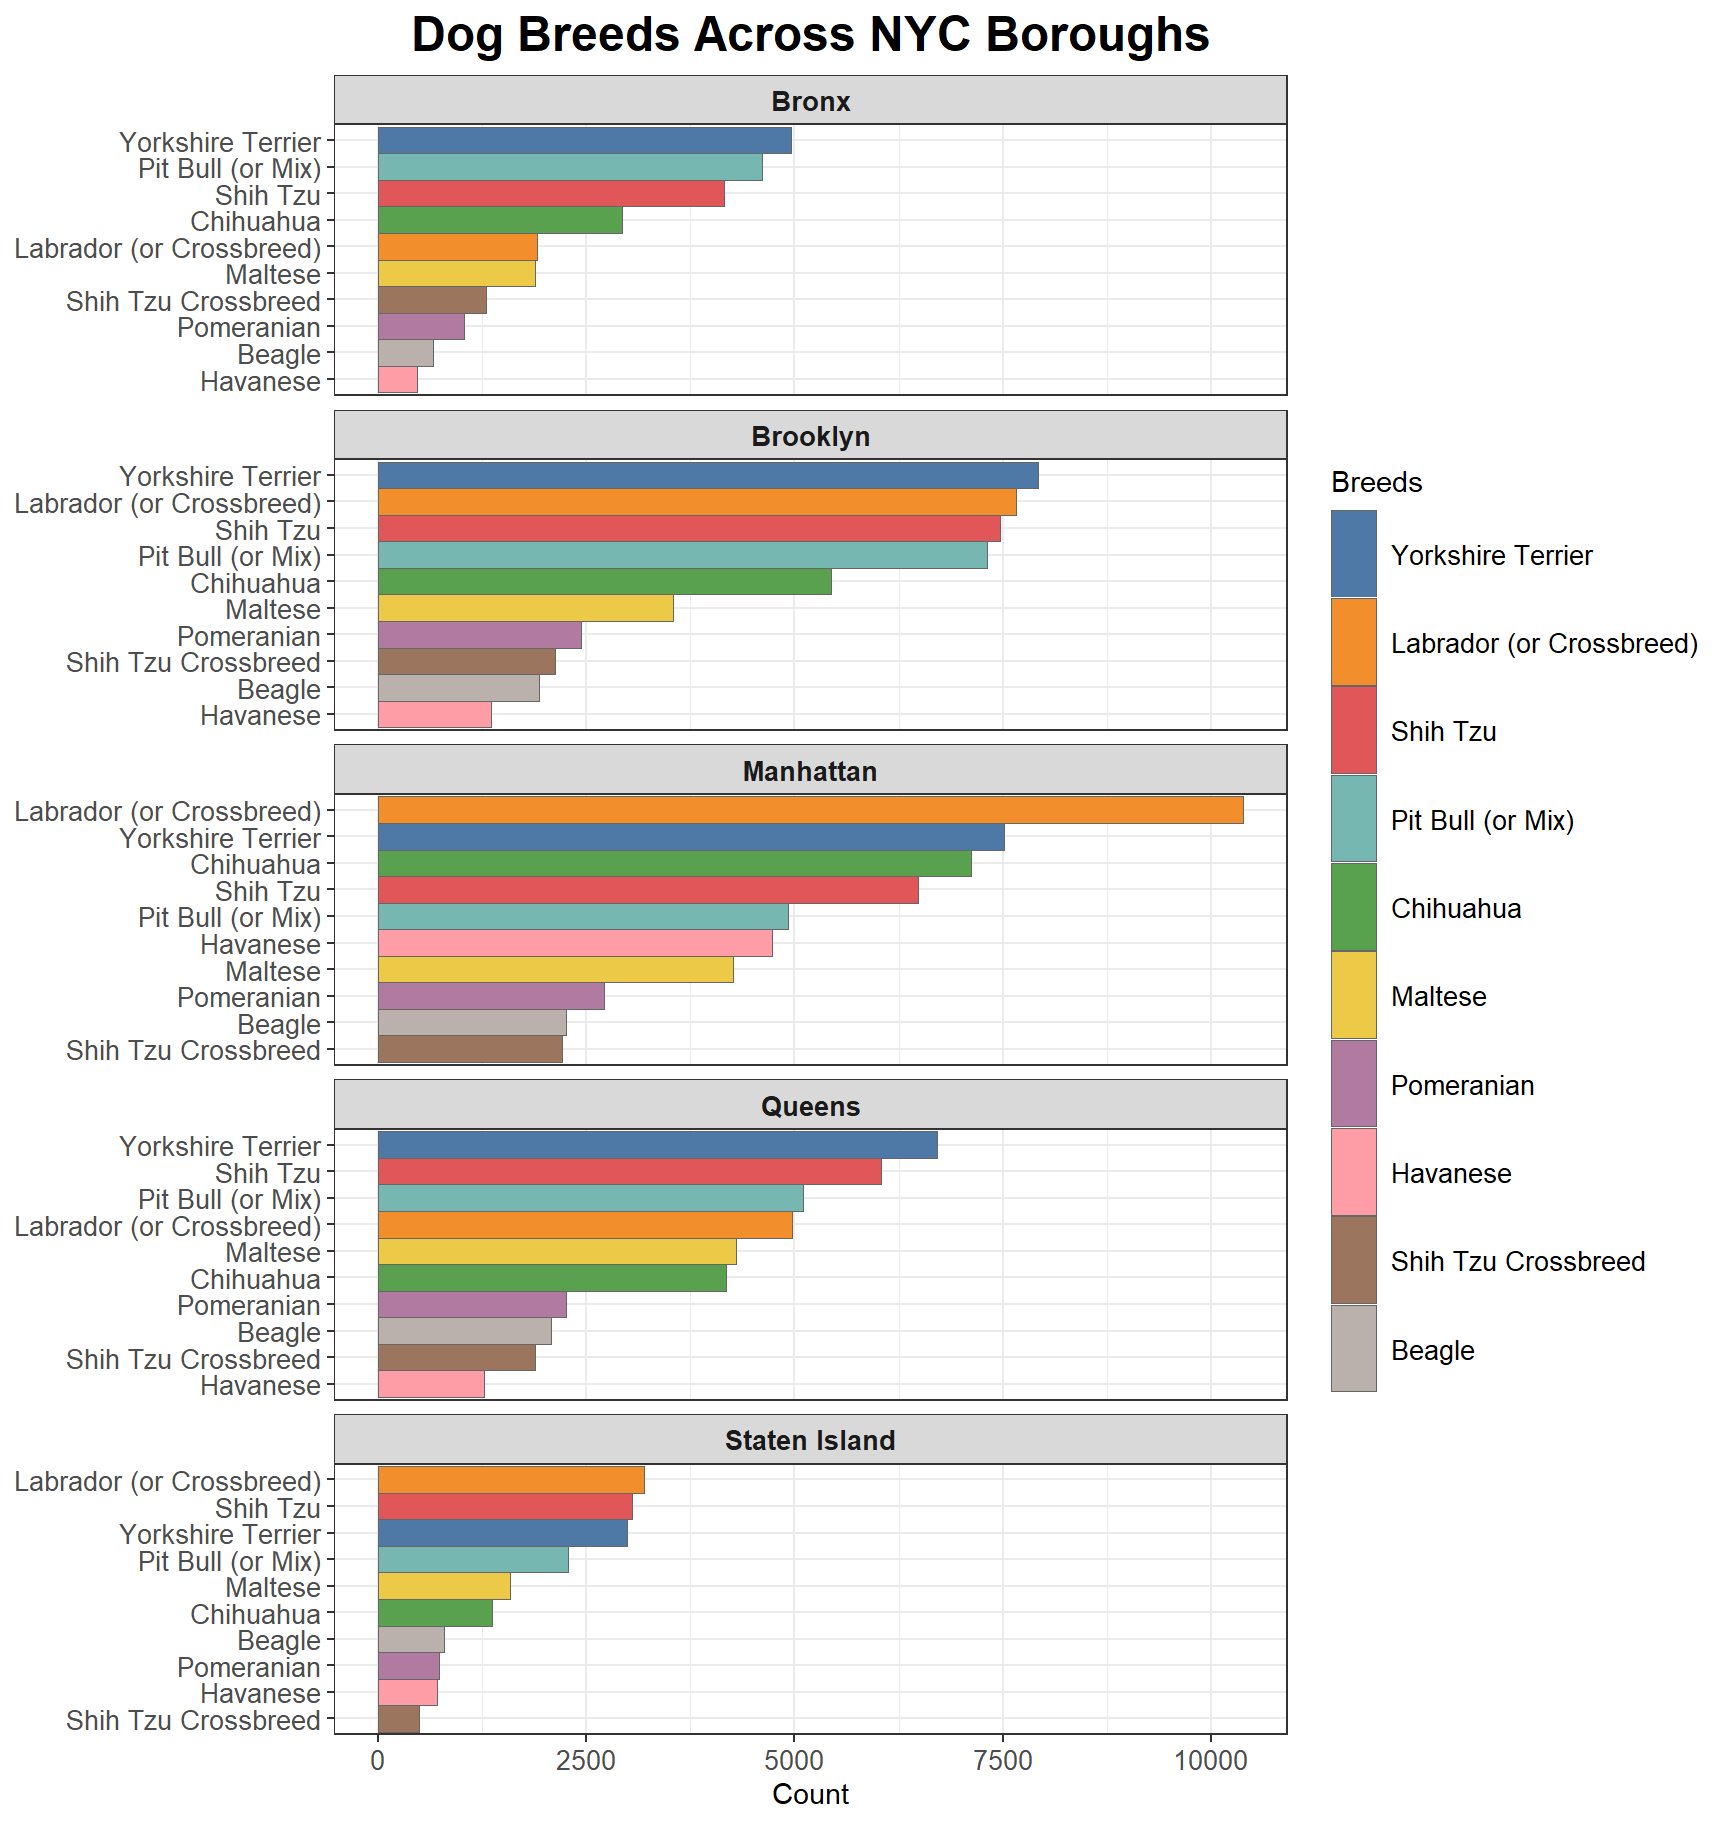
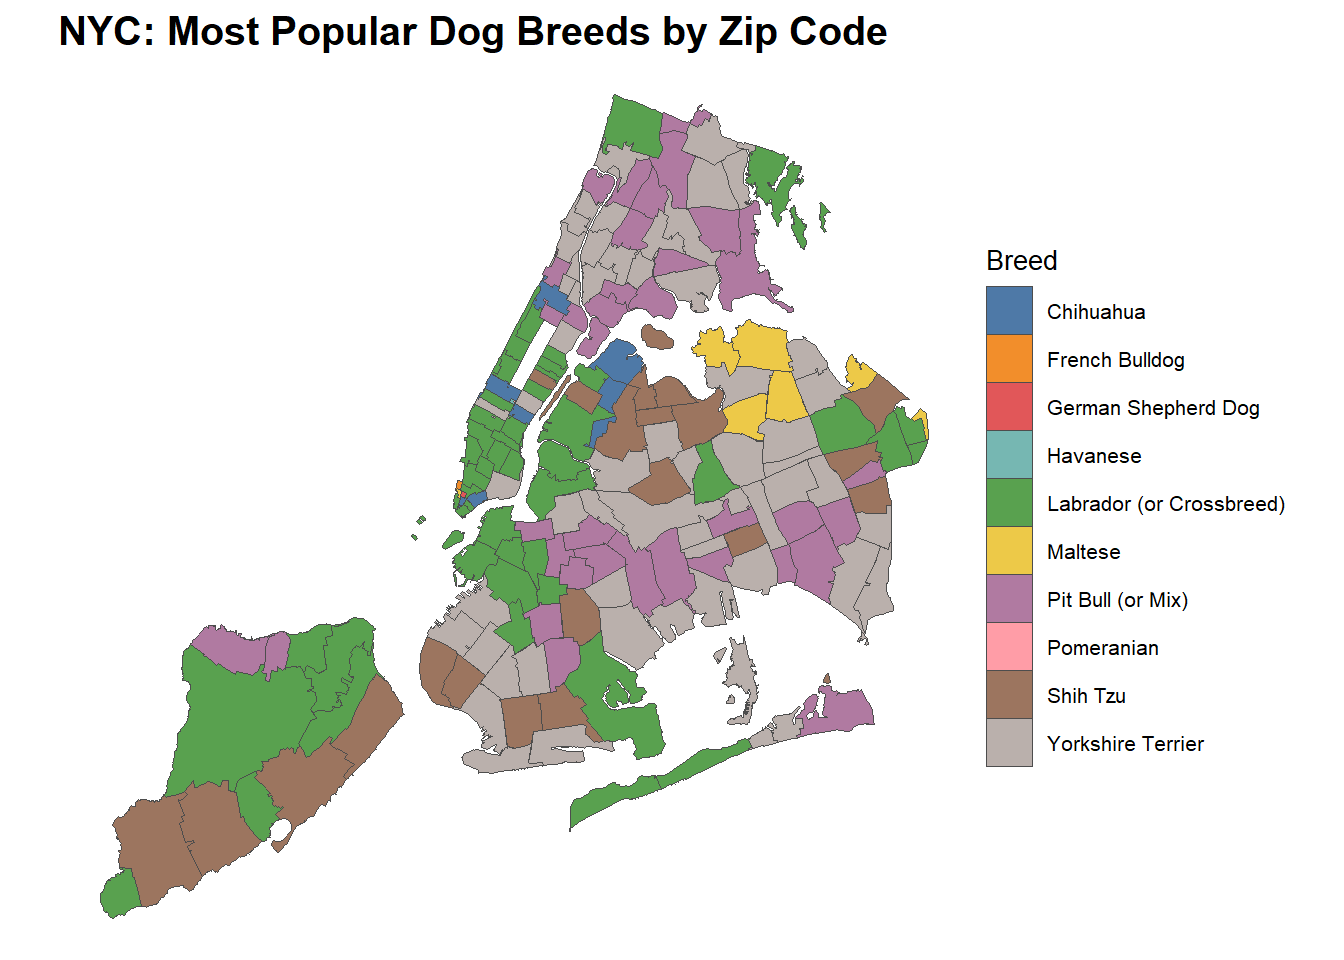
Popular Dog Breeds Across Zip Codes
breed_zips <- nyc_dog_license |> group_by(zip_code) |> count(breed_rc) |>
  mutate(prop_breed = round(n/sum(n)*100, 2)) |> mutate(is_max = ifelse(prop_breed == max(prop_breed), "Yes", "No"))
breed_zips_max <- breed_zips |> filter(is_max == "Yes") |> filter(!duplicated(zip_code))

breed_join_1 <- left_join(breed_zips_max, nyc_zips_df)
breed_join_full <- left_join(breed_join_1, nyc_zips_coord)
breed_join_full <- breed_join_full |> filter(!is.na(objectid))

reactable(breed_zips, columns = list(zip_code = colDef(name = "Zip Code"),
                                breed_rc = colDef(name = "Breed"),
                                n = colDef(name = "Count"),
                                prop_breed = colDef(name = "% Breed"),
is_max = colDef(name = "Most Popular?")))ggplot(breed_join_full, aes(x = X, y = Y,
fill = breed_rc,
group = objectid)) +
geom_polygon(color = "gray30", linewidth = 0.1) +
coord_map(projection = "albers", lat0 = 39, lat1 = 45) +
scale_fill_tableau() +
labs(title = "NYC: Most Popular Dog Breeds by Zip Code",
fill = "Breed") +
guides(fill = guide_legend(keyheight = 1.25)) +
theme_void() +
theme(plot.title = element_text(size = 15,
face = "bold"),
legend.title = element_text(size = 10),
legend.text = element_text(size = 8))